Software as a Service
I remember the time when software was sold in floppy disks or CDs in a bookstore. I feel old just thinking about it. It was a different world with a very simple business model. You buy a piece of software and you own it forever. That was a major pro even if it came with some downsides. For instance, if you bought Microsoft Office 95 you would have to buy Microsoft Office 97 to get the new features.
Advances on web standards, browsers, and the advent of cloud computing
opened the possibility of running software in data centers instead of our
personal computers. We don’t install software locally anymore, we
use our browsers as clients and connect remotely. We don’t buy CDs either,
instead we access web-based versions of the apps. Most importantly — we don’t
pay a final price for a product — we pay a monthly fee for access to that product.
We pay for the service this software provides.
In less than two decades the SaaS model has almost completely overtaken our lives. It’s very easy to come up with examples (Netflix, Spotify, Microsoft, Salesforce, Google Suite, etc), while at the same time it’s very to come up with examples of companies using the old model. Let’s study this business model better to see why it has become immensely popular.
Understanding SaaS levers
The best way to understand the (financial) behaviour of software as a service is to focus on cash flow and how it changes depending on the input variables. To start, let’s imagine the cash flow for our first customer.
One customer
In the simplest scenario, our input variables will be:
- Monthly payment for the service
- Number of payments
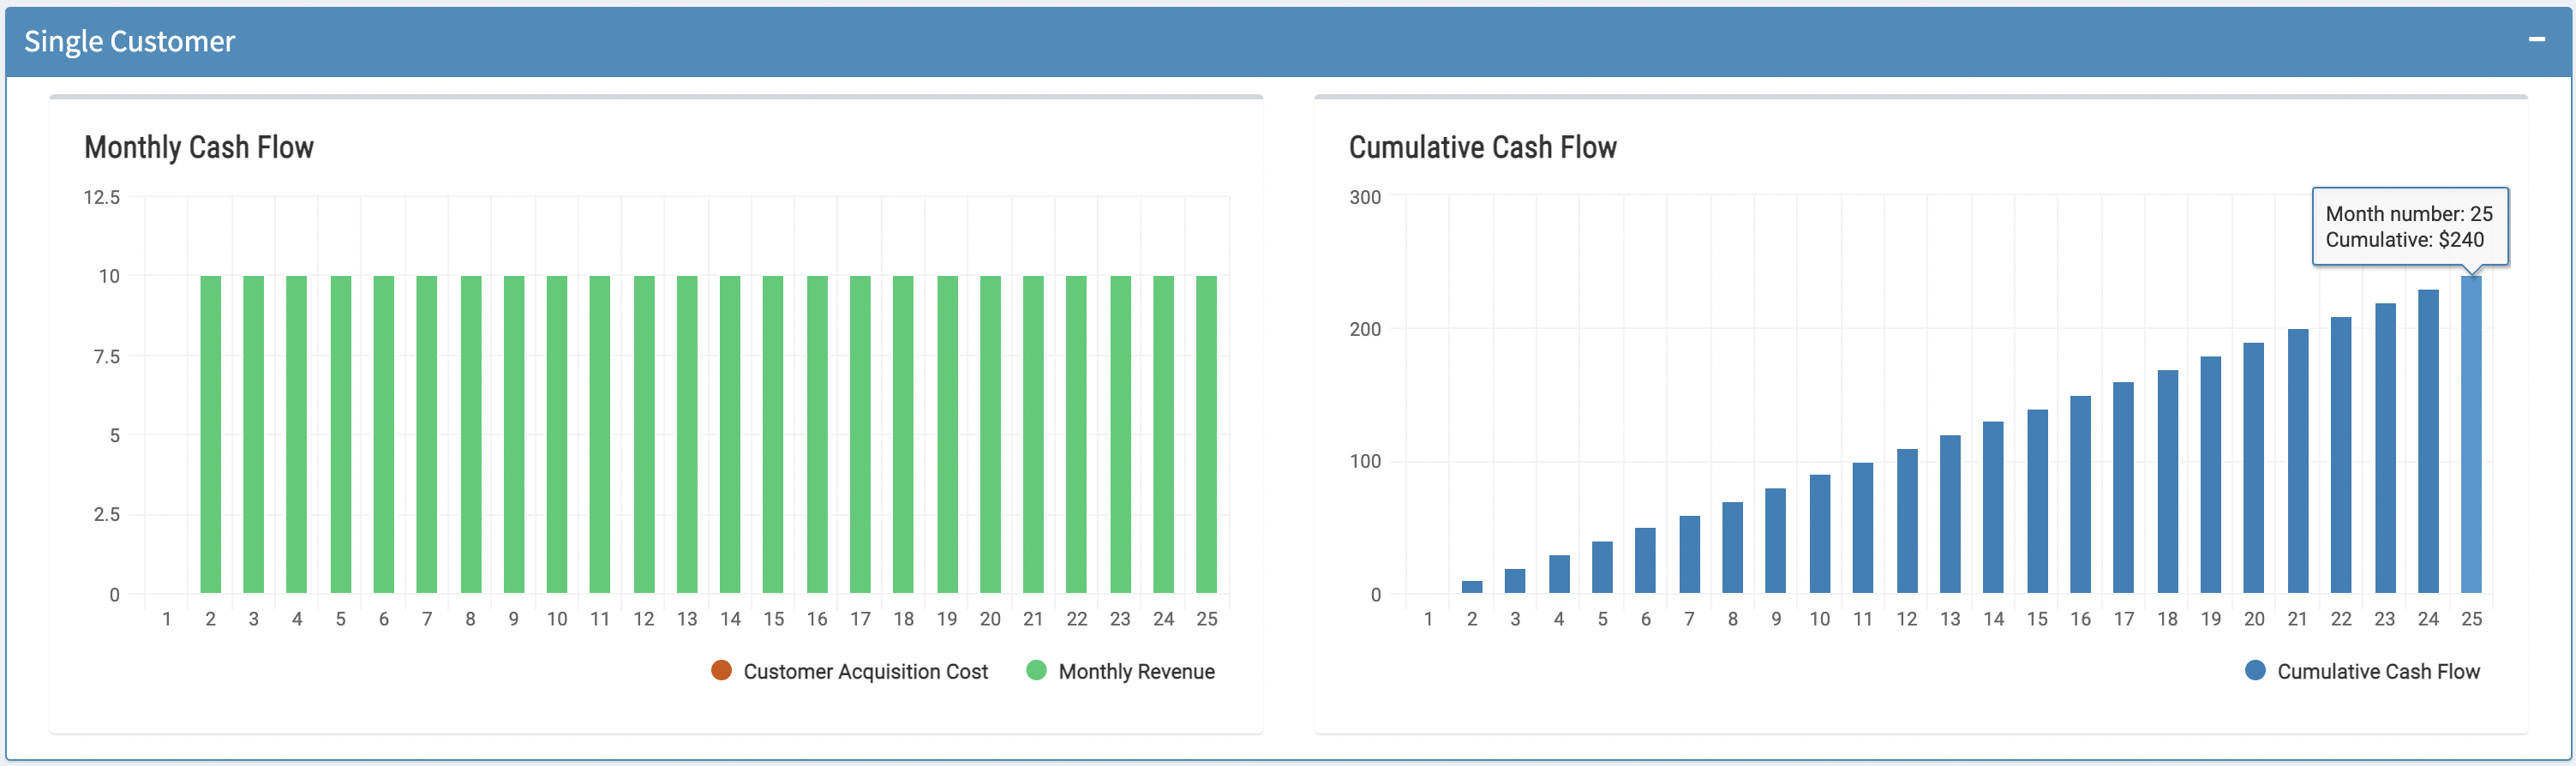
If our monthly payment is $10, we accumulate a total of $240 after 24 months. This is how our cash flow would look like:
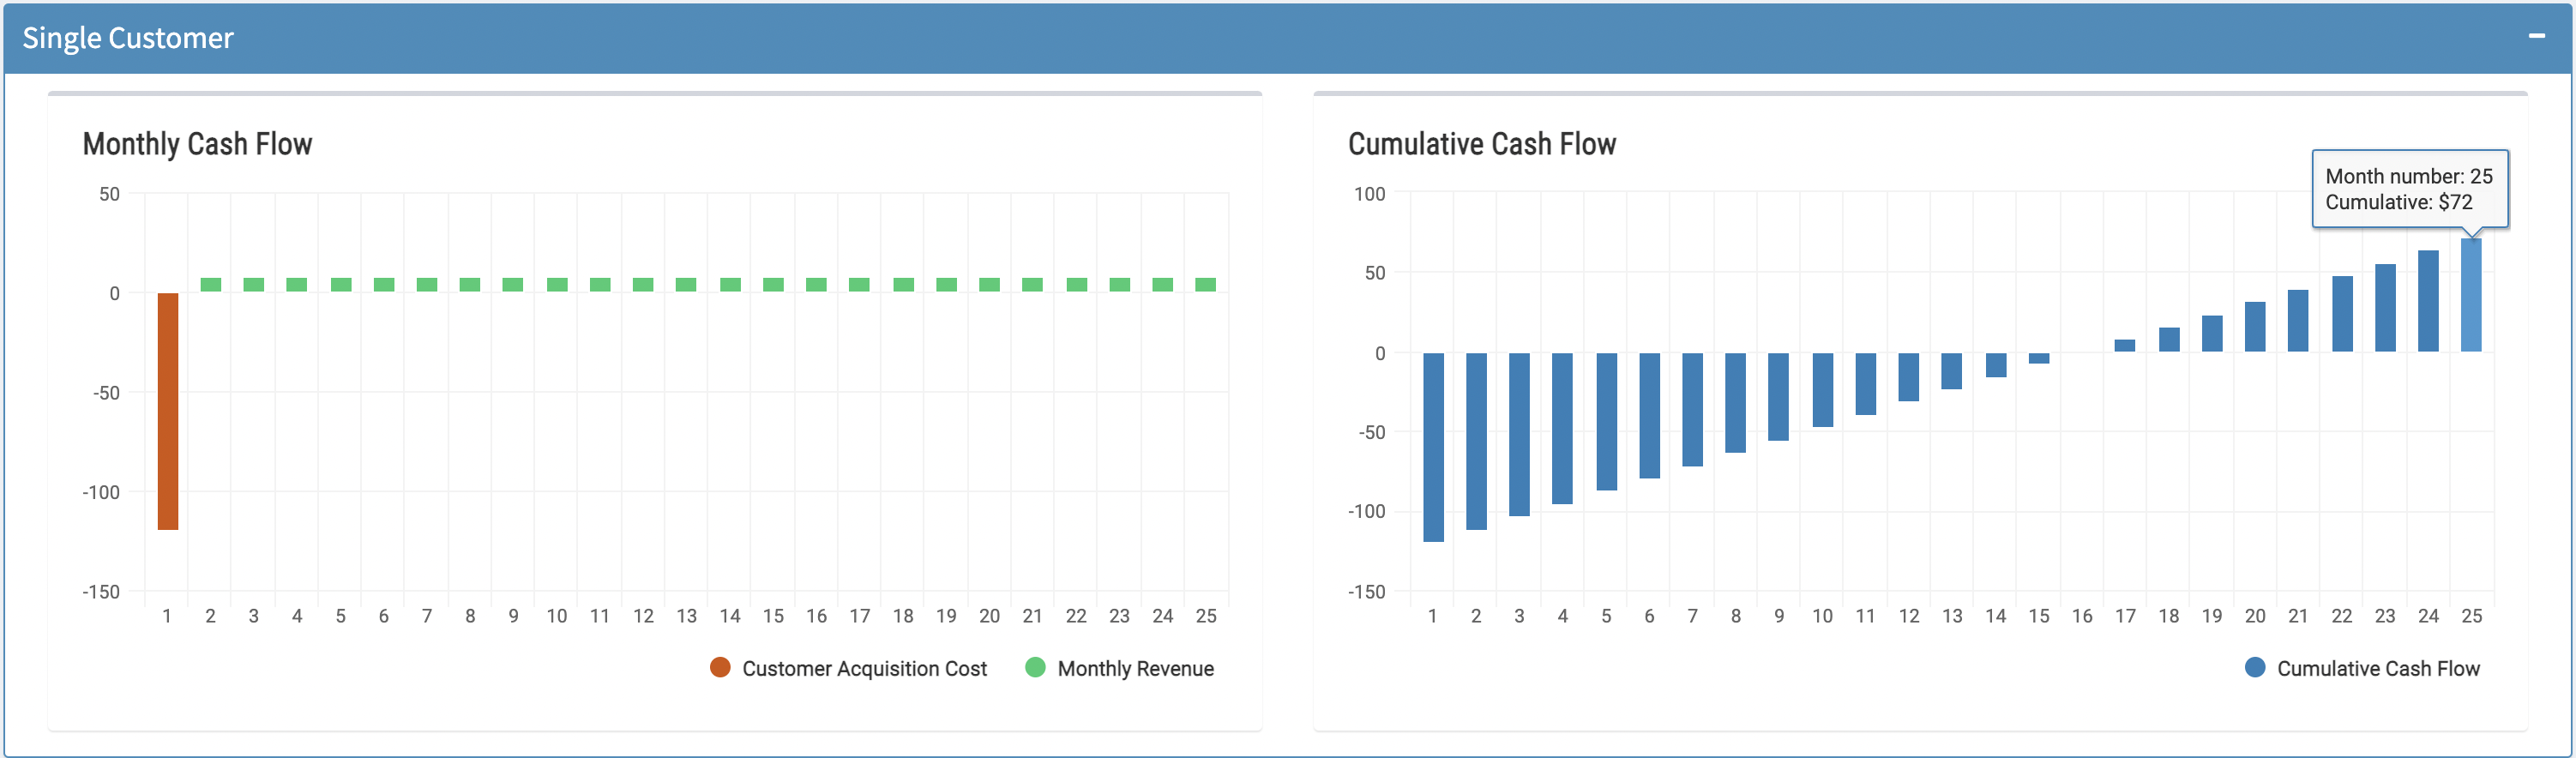
In reality, there are more variables we have to take into account. One we will hear often is CAC (Customer Acquisition Cost). It’s an estimate of how much money we spend in order to gain one subscription. A typical item included here are marketing expenses for prospective customers.
Imagine our CAC for the service above is $120. It means it takes a whole year of monthly payments to recover the initial investment to acquire this customer. This break-even point is called CAC Recovery Period.
One more variable mention often is margin (or gross profit margin) which is the percentage of the revenue left after paying for the cost of goods sold. Knowing what to subtract can be tricky since software doesn’t need any physical material to be produced. Two typical costs to subtract here are the cost of customer support and the cost to run the service (web infrastructure). A margin above 80% is considered pretty good and even in that case it changes the CAC Recovery Period above from 12 months to 15 months.
Summary
- Input: monthly payment, customer acquisition cost (CAC), margin, number of payments.
- Output: CAC recovery time (months to recovery), cumulative cash at month N.
Multiple customers
Things get a little more complicated when add multiple subscribers to our forecast. The trick is to remember we have same variables as above but a number of subscribers can join or leave the service at each month. This number of users leaving a service is known as churn and will be given in percentage. When we say churn is 1% a month we mean 1% of the total number of users will cancel the service at the end of each month. This number is an estimation and the more data we have about the particular business the more accurate it will be.
For the purposes of our simulation, the other two input variables will be initial number of customers and number of new monthly customers.
Let’s put it all together:
- Monthly payment: $10
- Customer acquisition cost: $120
- Margin: 80%
- Churn: 2% per month
- Initial number of customer: 10
- New customers each month: 10
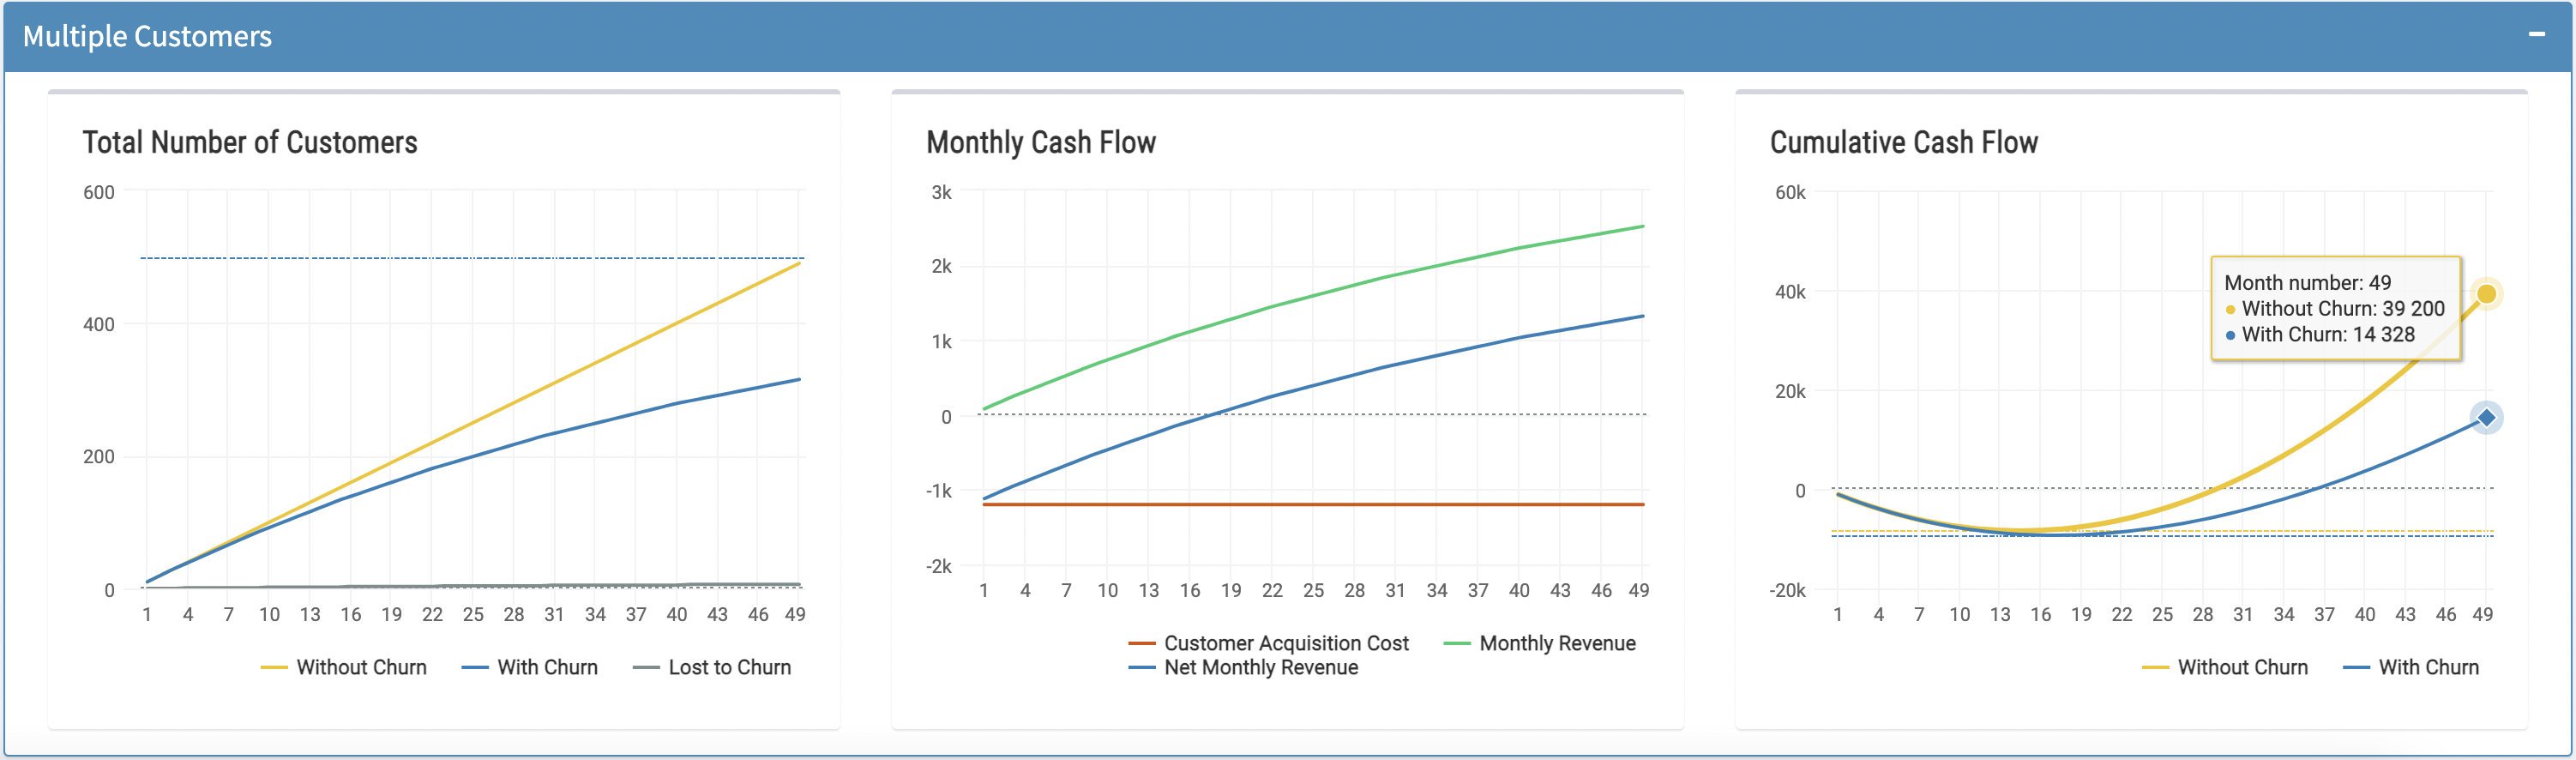
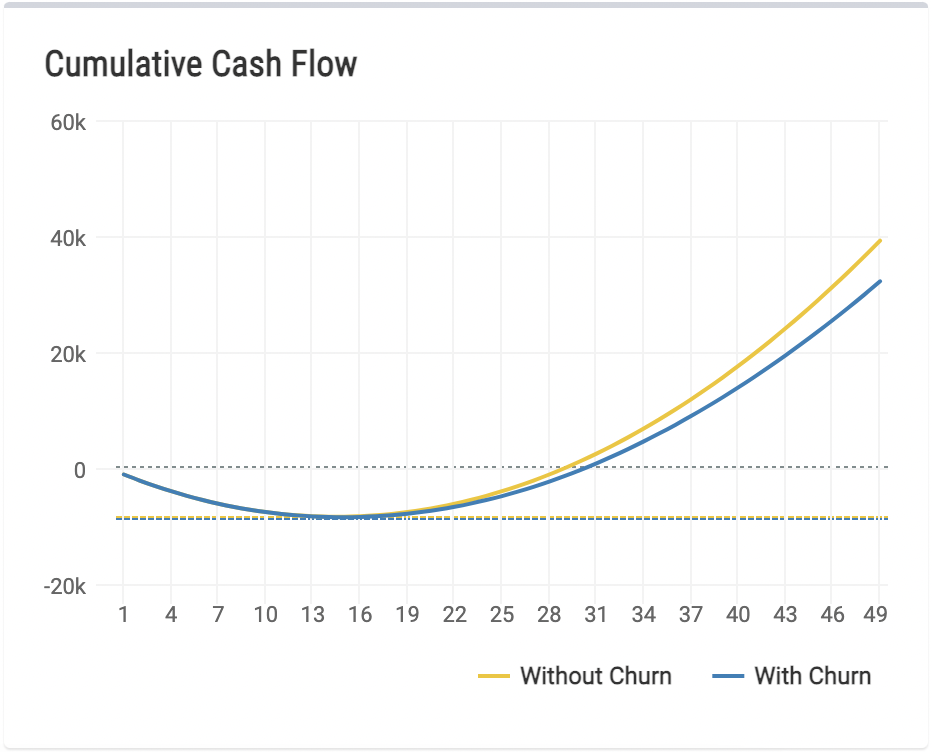
The chart for the cumulative cash flow here is super interesting. We see it’s increasingly negative in the first few months — when we pay dearly to acquire new customer. In the same chart we see we later break even and after that the cumulative cash flow increases wildly. There are a few important values we can calculate from here:
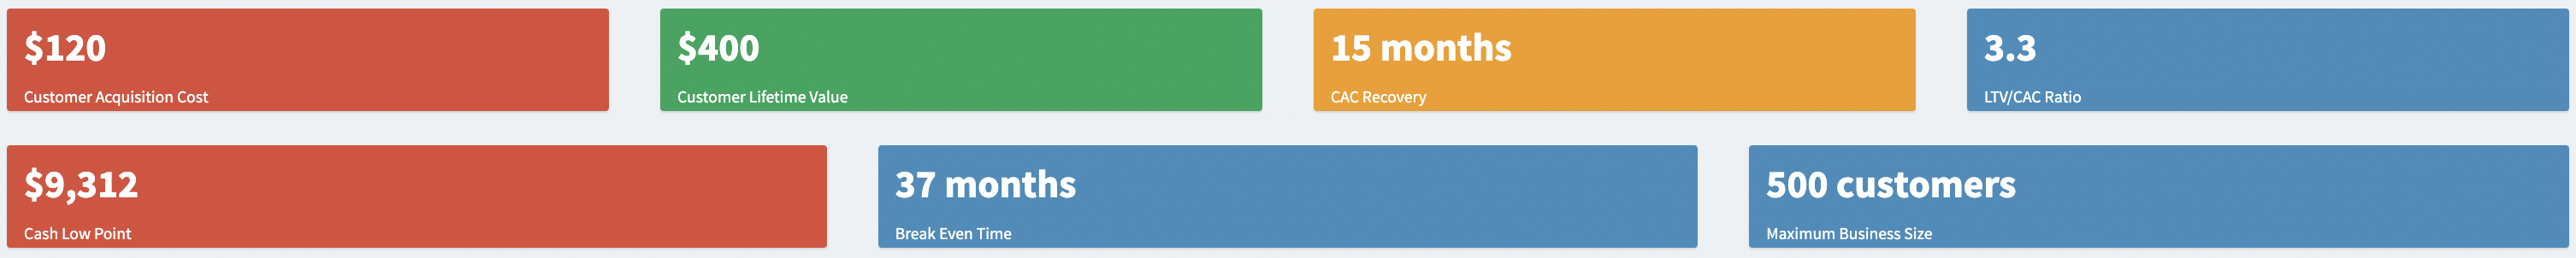
Customer Lifetime Value (LTV)
Some of the most important concepts here are lifetime of and lifetime value (LTV) of the customer.
- Lifetime = \(\frac{1}{churn} = \frac{1}{2\%}= \frac{1}{0.02} = 50\) (months)
- LTV = \((revenue \cdot margin) \cdot lifetime = ($10 \cdot 80\%) \cdot 50 = \$400\)
Note: I have another post where I delve deeply into churn and deduce the formula for lifetime.
Additional metrics
Some additional metrics are mentioned often in the literature like LTV/CAC. This ratio is an indication of profitability, it tells us how many dollars we will receive on average from a user for each dollar invested to acquired them.
There are other metrics we can calculate that are less common but can be super helpful:
- Cash Low Point: amount of money needed to survive while heavily investing in user acquisition and before breaking even.
- Break Even Time: moment in the future where the cumulative revenue from users balances out the investments in acquisition.
- Maximum Business Size: mathematical limit on the number of subscribers possible at the current level of churn.
(Low) Churn is a super power
If there is one thing I would like you to remember after reading this post is the importance of churn. All input variables are important of course. If the cost to acquire a customer is higher that the revenue that user brings during its whole lifetime then the business is not going to be sustainable (one too many examples out there). Churn on the other hand can be more subtle. Low churn means users are staying with us. It means they are happy and get value from the service!
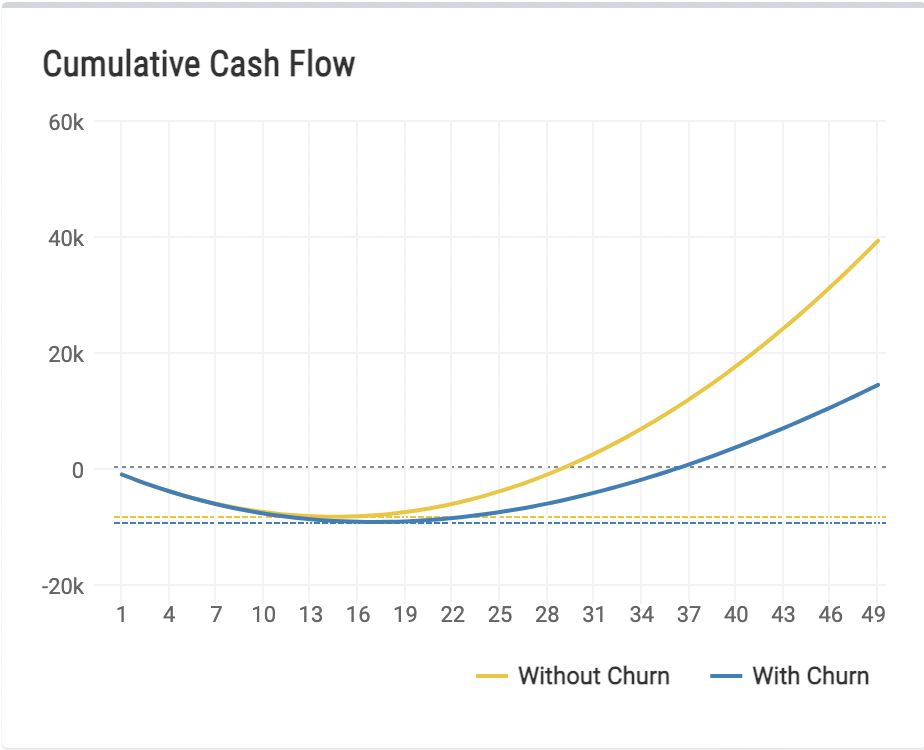
Below is the same chart for cumulative cash flow with varied levels of churn
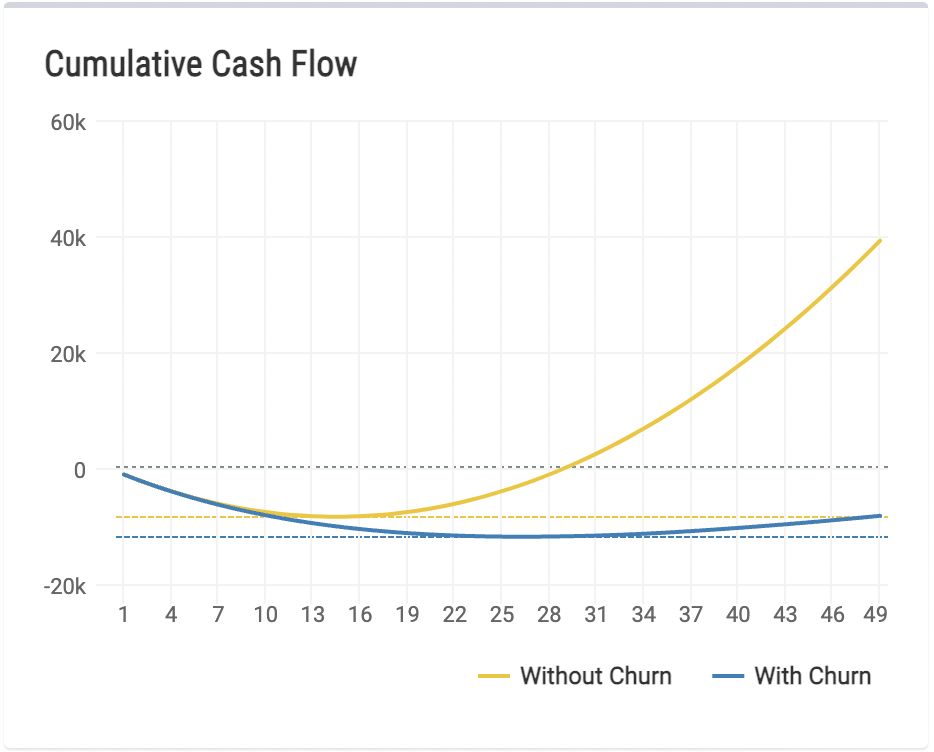
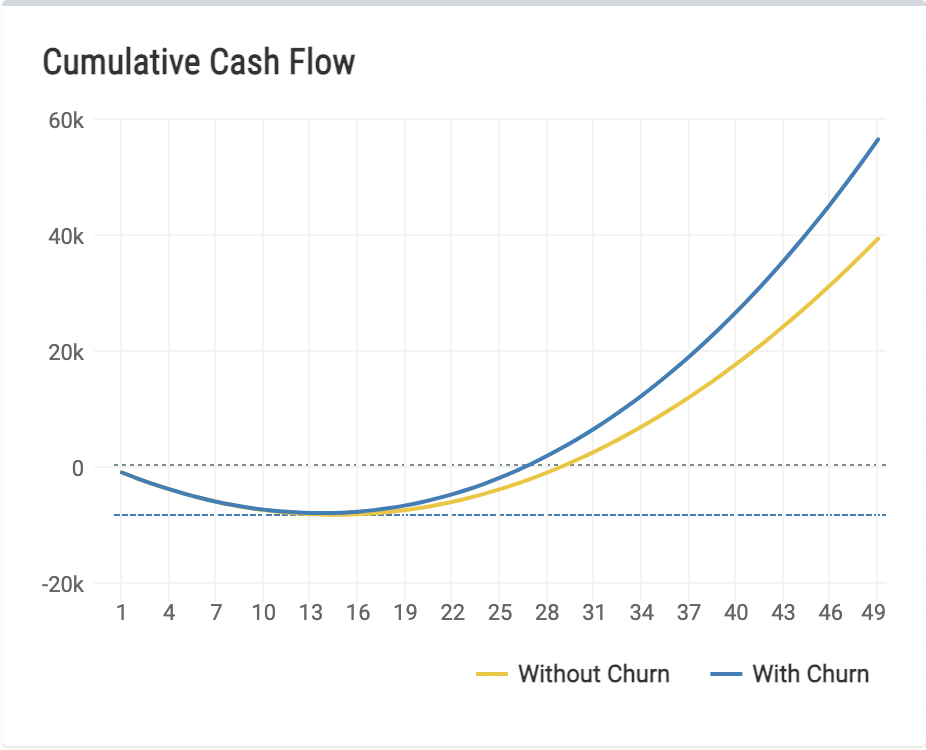
With a churn of 5% it takes 76 months to break even and the ship will be so leaky that the business will never manage to grow.
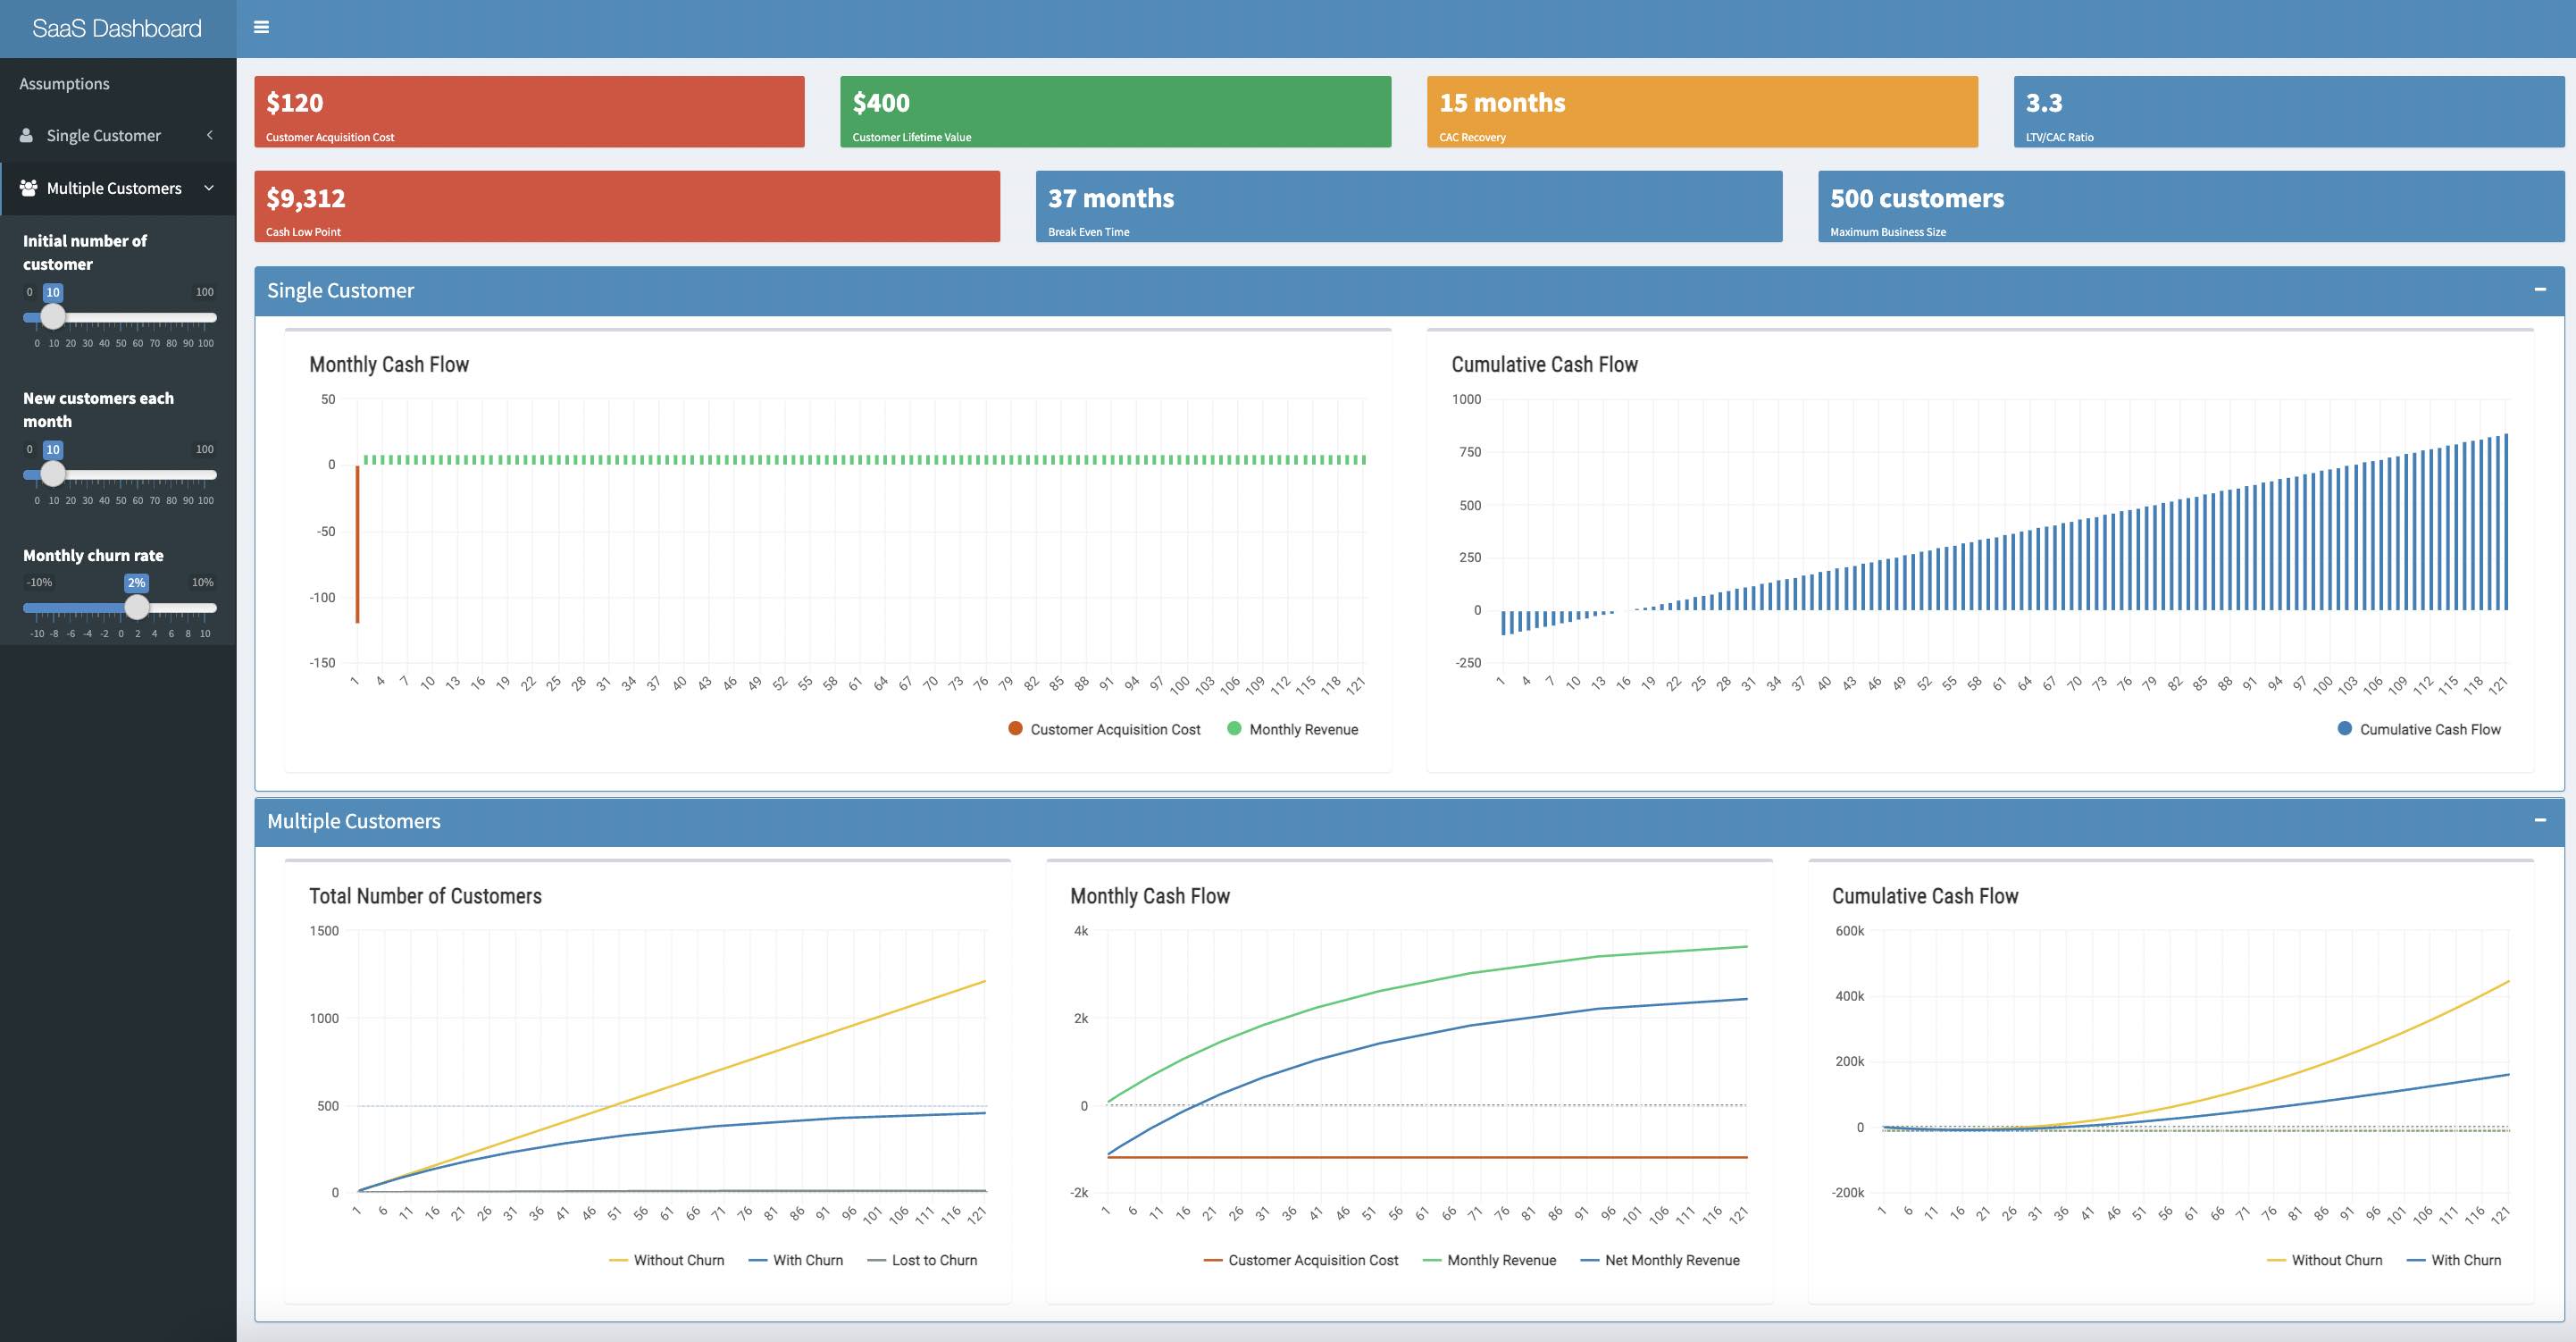
SaaS dashboard
Images come from this SaaS dashboard created with R Shiny. Give it a try to see how even small changes can have massive repercussions.