
Visualizing Ethereum data with Metabase
In our previous posts, we covered how to set up an Ethereum node, extract data from it, and transform that data. Now, we’re moving on to one of the most exciting parts of data analytics: visualization.
When it comes to business intelligence tools, there are plenty of options available. Two of the most popular commercial tools are Tableau (now owned by Salesforce) and Looker (recently acquired by Google). Personally, I find Looker to be particularly intuitive and user-friendly. Opting for a paid tool can be a great choice if you’re looking for additional support and a high-quality user experience.
However, if you’re looking for an open-source solution, there are excellent options available, such as Redash, Superset, and Metabase. For this example, we’ll be using Metabase due to its easy setup and intuitive interface. Remember that we used the data transformation step to perform complex logic, so we’ll be avoiding complicated queries within the visualization.
Installing Metabase
The official commands to pull and run the docker container:
docker pull metabase/metabase:latest
docker run -d -p 3000:3000 --name metabase metabase/metabase
Unfortunately, there seems to an issue when running this image in Macs with the M1 chip. Not to worry though, as there’s a workaround that involves building the image ourselves with the right configuration. For the purpose of this post, I’ll be using an image that has been built by someone else, but it’s worth noting that if we were to use this image in a production setting, we would want to build it from scratch.
docker pull bobblybook/metabase
docker run -d -p 3000:3000 --name metabase bobblybook/metabase
Setting up Metabase
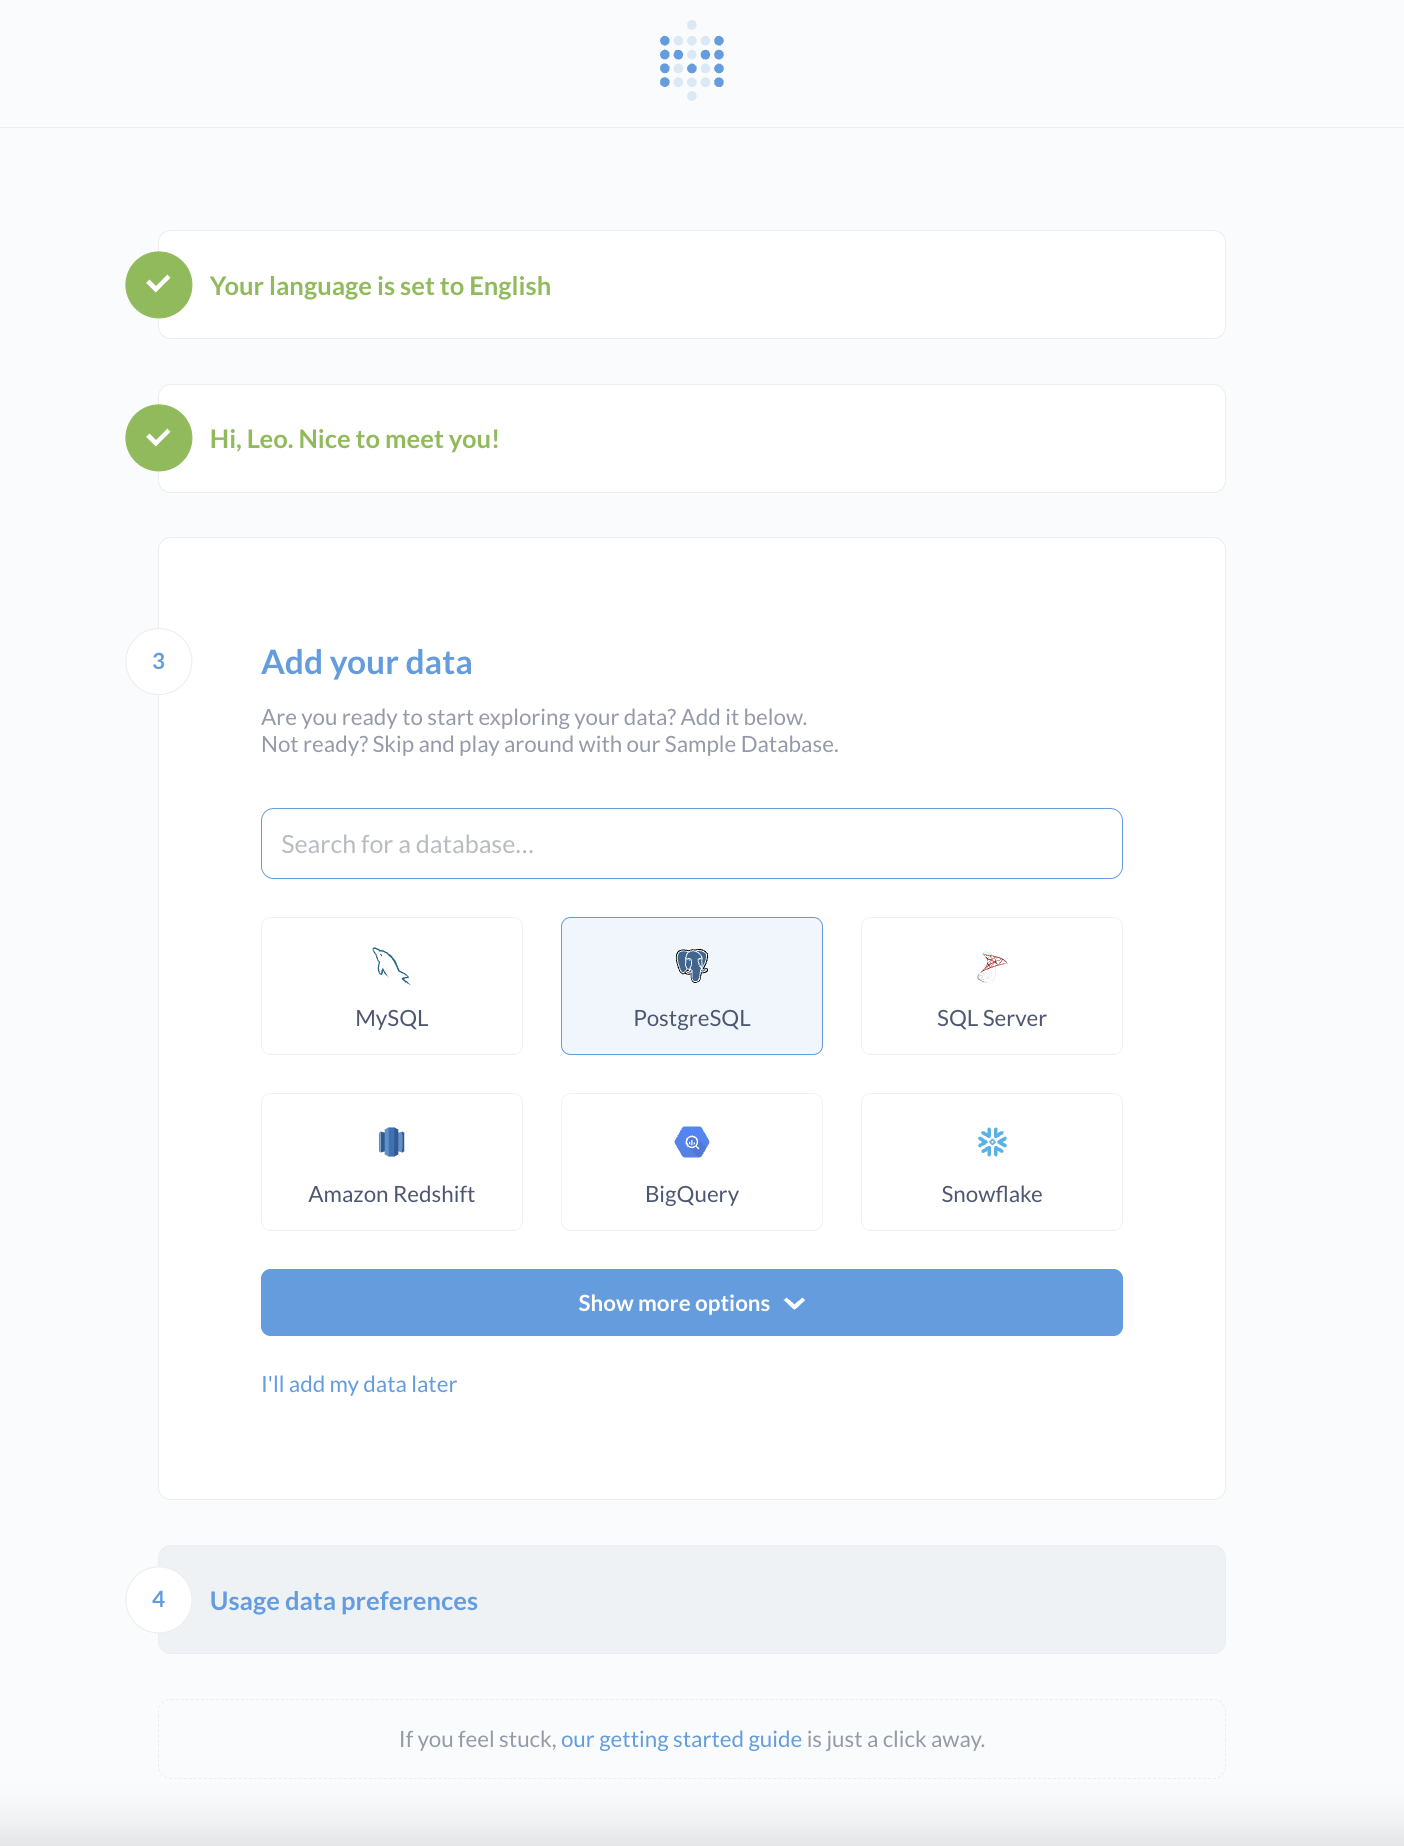
When it comes to setting up our Metabase instance, the most important step is establishing a connection to the database. In this particular case, we’ll be using the same postgres instance that we’ve been using in our other examples.
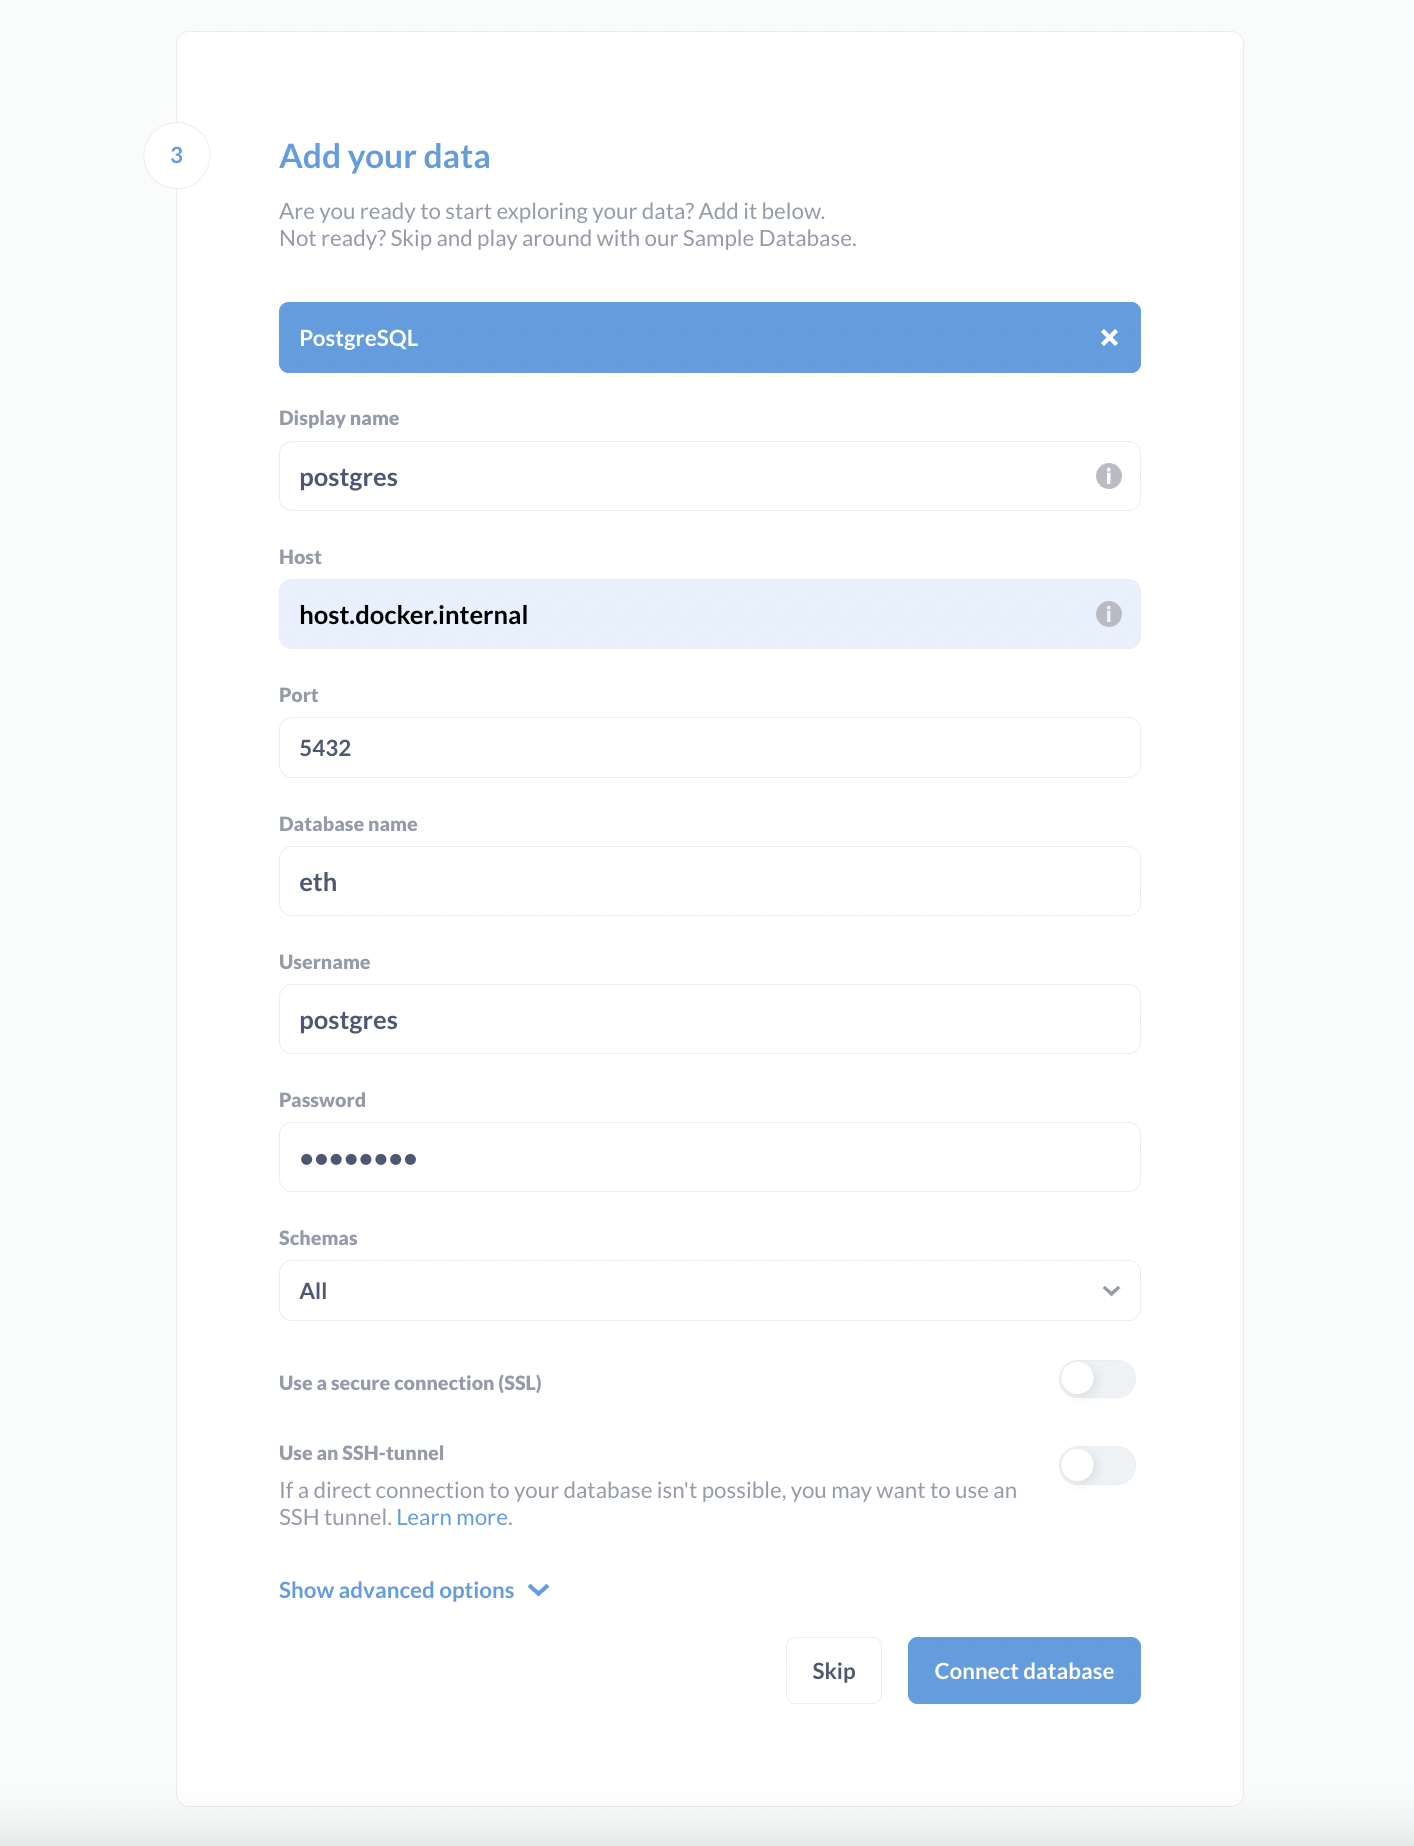
Note: we are using Metabase from a docker image. In order for it to connect to a service running in our laptop we have to use the docker equivalent for localhost: host.docker.internal.
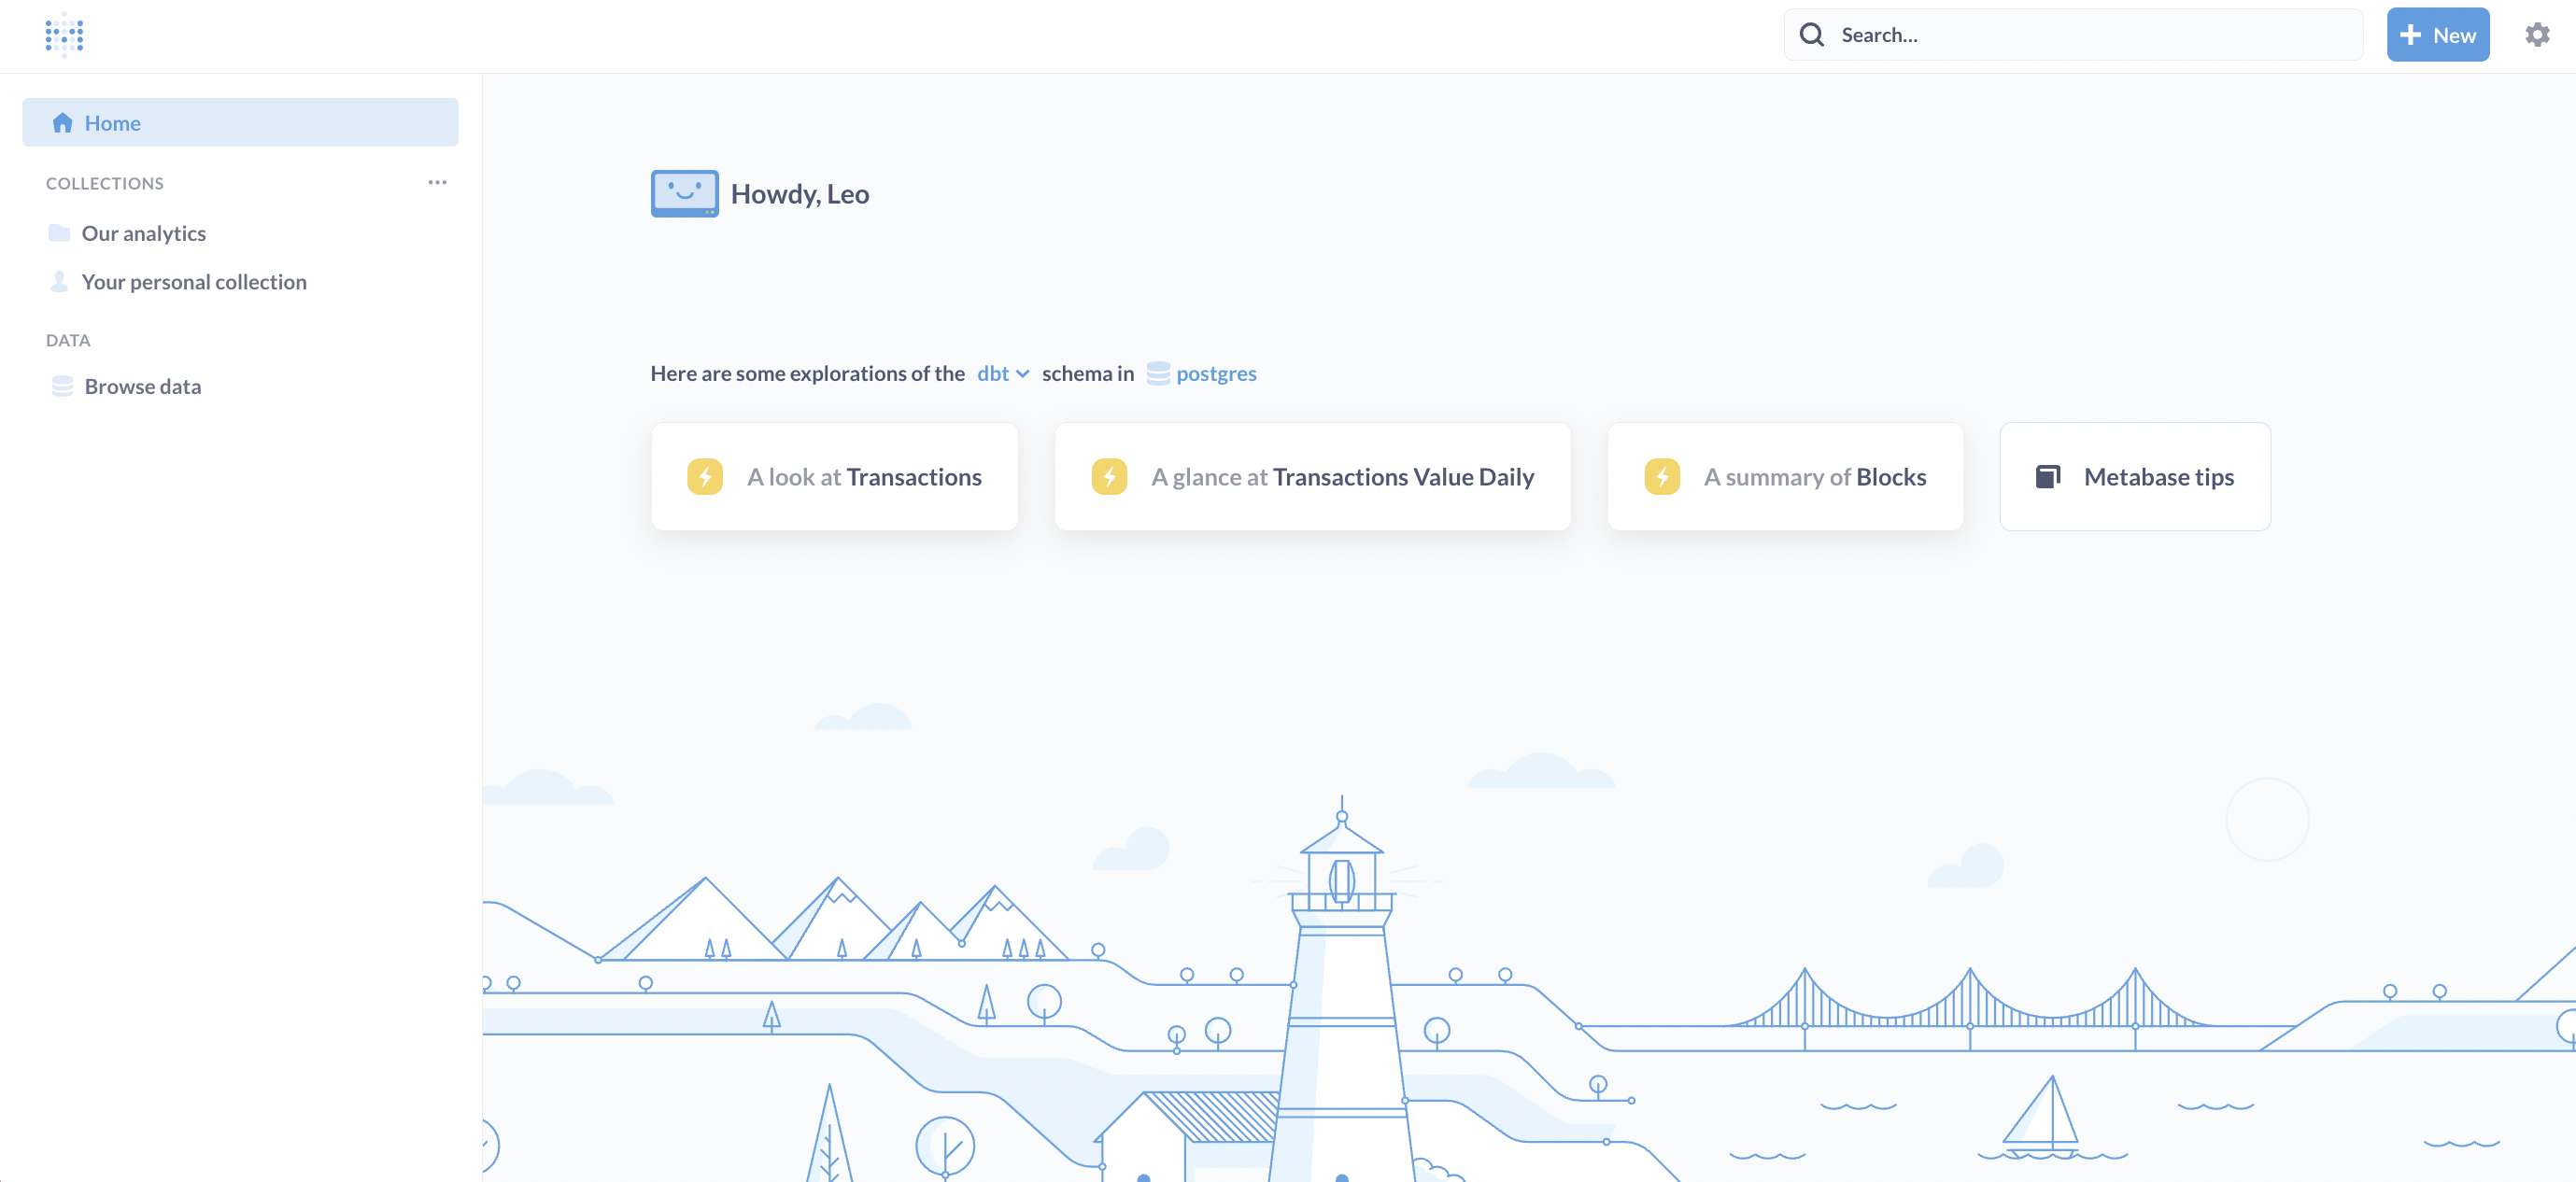
Creating our first dashboard
Metabase is indeed an intuitive tool that won’t take you long to get the hang of. With just a few minutes of exploring the interface, you’ll be able to create your very first chart. For those who want some inspiration, the official docs have some excellent examples to help you get started.
Here’s what we will need to do in our case:
- Go to the home page
- Click on
+ New - Select question or sql query
- Choose the table
- Select the relevant fields, filters and summaries
The last step is Metabase’s user interface, the equivalent of a sql query when we choose the question option.
Once you’ve familiarized yourself with the tool, you’ll be able to develop your first Ethereum dashboard in no time! 🚀
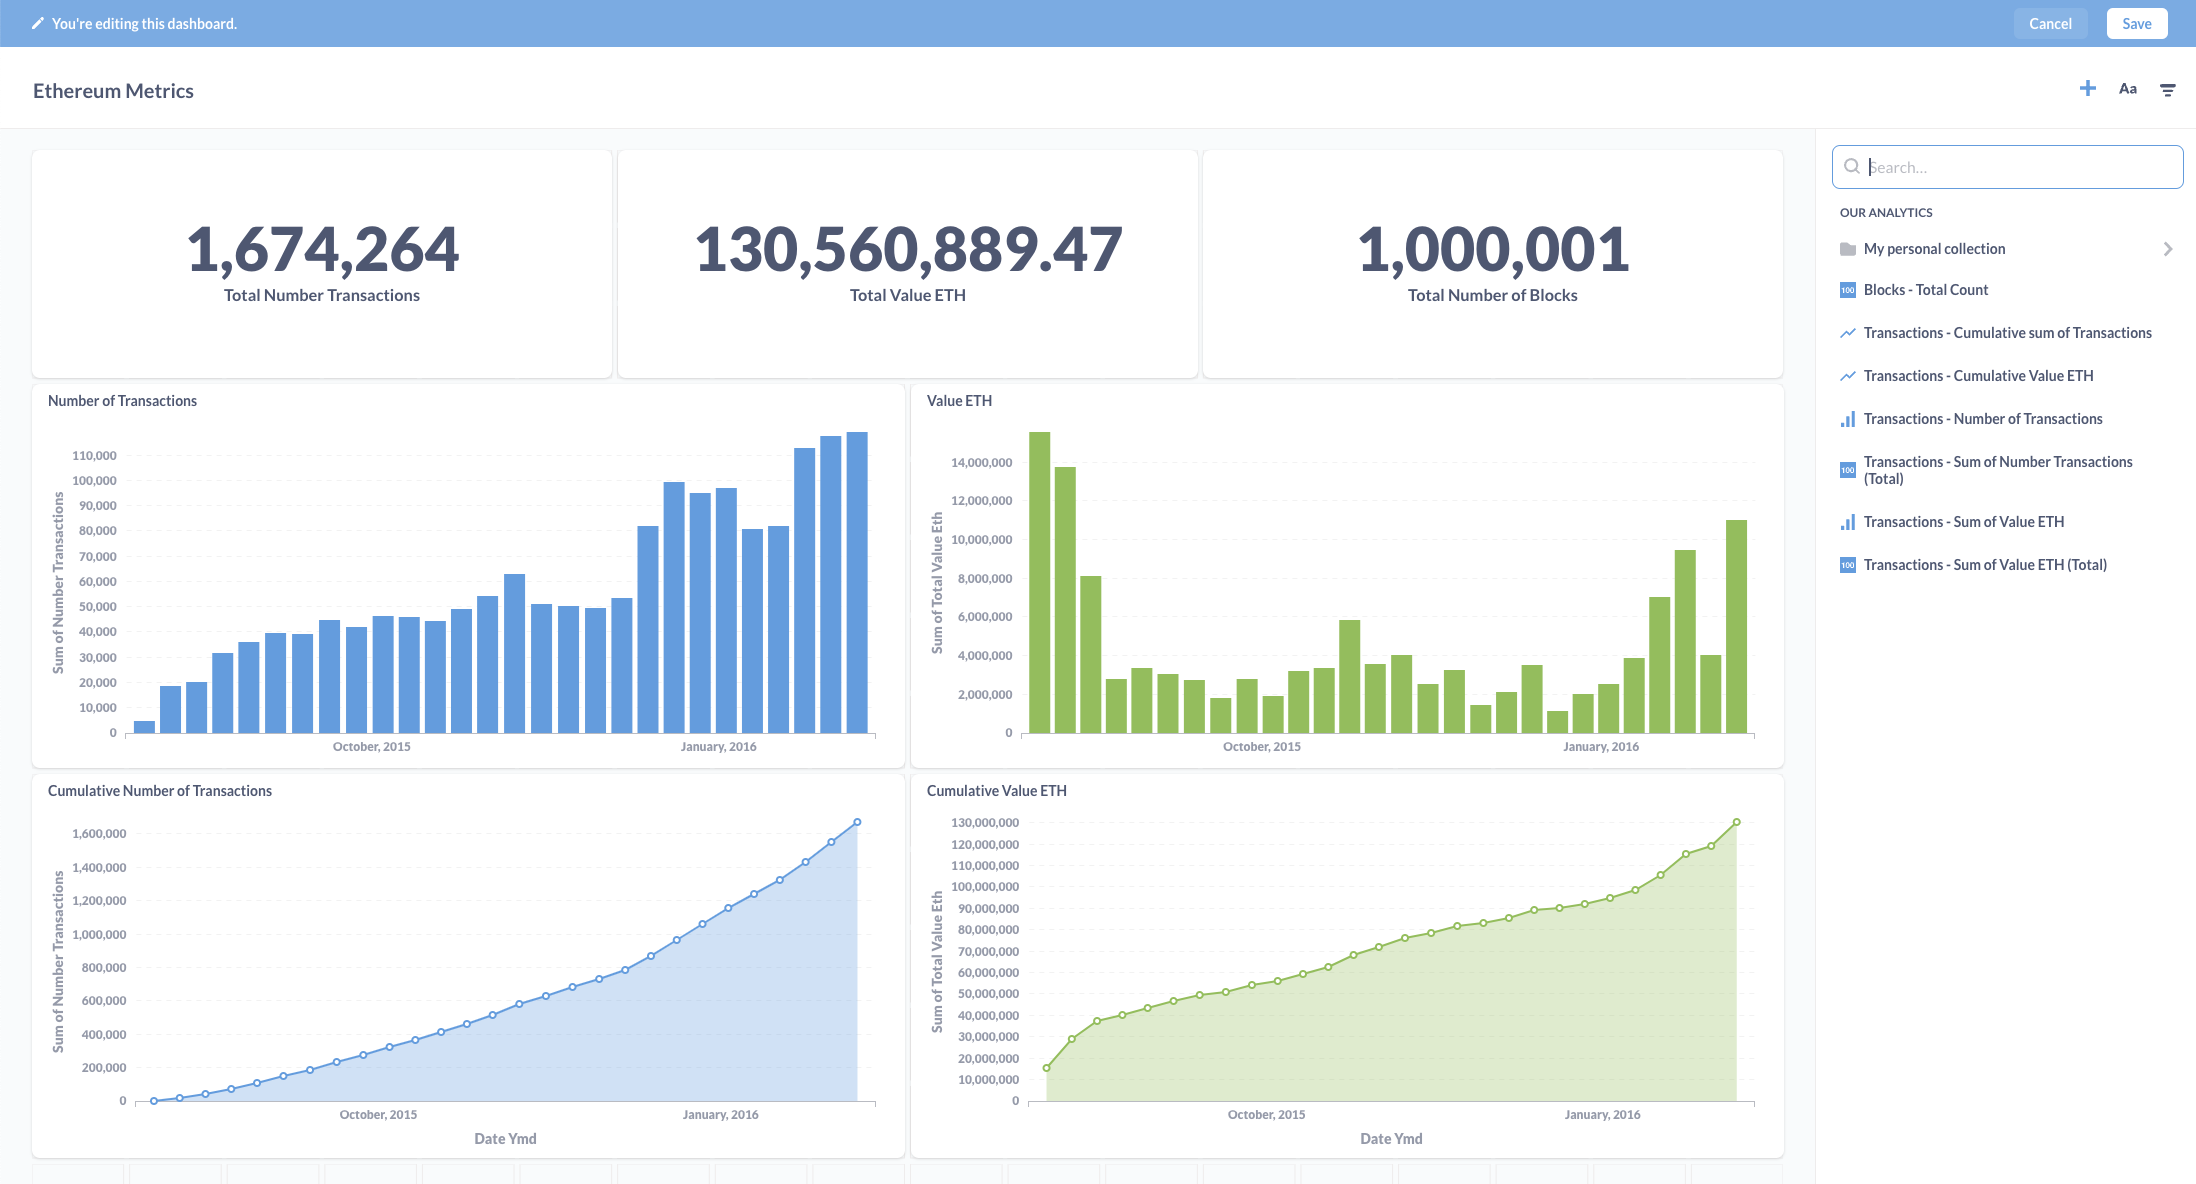
One thing to keep in mind is that in this particular example, we’ve extracted only the first million blocks using Airbyte. If you’re looking to productionize this data pipeline, it’s important to ensure that you’re processing data incrementally and always staying up to date.